A Quick Glance

  • black-arrow

    Work efficiently with MS Excel 2016 and its latest features

  • black-arrow

    Find what’s new in MS Excel 2016

  • black-arrow

    Printing of a workbook

  • black-arrow

    Handling with date formats

  • black-arrow

    Review Excel terminologies

  • black-arrow

    How to use VLOOKUP and HLOOKUP

  • black-arrow

    Use cell themes and styles

  • black-arrow

    Use features that will enhance the quality of your work

Microsoft initiated with spreadsheet program called Multiplan in 1982.But Microsoft lost on popularity to LOTUS 1-2-3. This was when Microsoft launched MS Excel for Mac in 1985, and for Windows in 1987. This Intermediate level of MS Excel 2016 course gives you the extra skills delegates required to be more valuable at their jobs. Also, perform the more important task at their workplace.

MS Excel 2016 is part of the MS Office package that is used commercially everywhere in across the worldwide. Now delegates have access to a step-by-step training that empowers you to become a skilled user of MS Excel. Each concept in this course is well explained in detail with visuals.

Who should take this course

  • Sales Manager
  • Investment Banker
  • New Users Microsoft Excel 2016
  • Users wants to update their skills
  • Auditor
  • Credit Counselor
  • Business Analyst
  • Finance Analyst
  • Engineering Graduates
  • Data Scientist
  • Clerk
  • Market Research Analyst
More

Prerequisites

  • It will be beneficial if delegates have knowledge of the appropriate Windows OS.
More

What Will You Learn

  • Learn to use formulas and functions
  • Create and modify charts
  • Convert, filter, sort and manage lists
  • Adding and modify illustrations in a worksheet
  • Working with tables
  • Analysis of data by using functions and conditional formatting
  • Performing calculations in an Excel worksheet
  • Use conditional formatting and styles
  • Managing the workbooks in MS Excel 2016
  • Perform data visualisation, i.e., represent data by using basic charts
  • Build advanced formulas
  • Organise and analyse datasets
  • Customisation of MS Excel environment
  • Modification of an Excel worksheet
  • Importing, fine-tuning, and sharing Excel data
  • Creating, managing, and launching of macros
  • Create spreadsheets using MS Excel 2016
  • Optimisation of worksheets using graphs, templates, and formulas
  • Design complex formulas by nesting of MS Excel functions
  • Make your decisions using PivotTables, Slicers, and PivotCharts
More

What's included

  Course Overview

MS Excel 2016 can help delegates in organising, calculating, analysing, revising, updating, and presenting your data in ways that will help the senior management to make a decision in your organisation steer you in the right direction. 

Delegates will get skills to analyse large amounts of data, extract useful information from it, and present that information to senior management is the necessity of a successful organisation. This training starts by explaining basic terminologies, tips and tricks of the ribbon, and shortcuts of MS Excel 2016.

It will also teach you about the creation of charts and graphs with data. To handle large datasets available and being build on a nearly continuous basis, as we all know data is becoming more critical and challenging in today's world.

To gain a competitive edge over their competitors, Delegates will need to know how to extract actionable data insights from raw data i.e. when you have any questions; you need to know how to Excel provide you with the answers. It is an aim only to design this course.


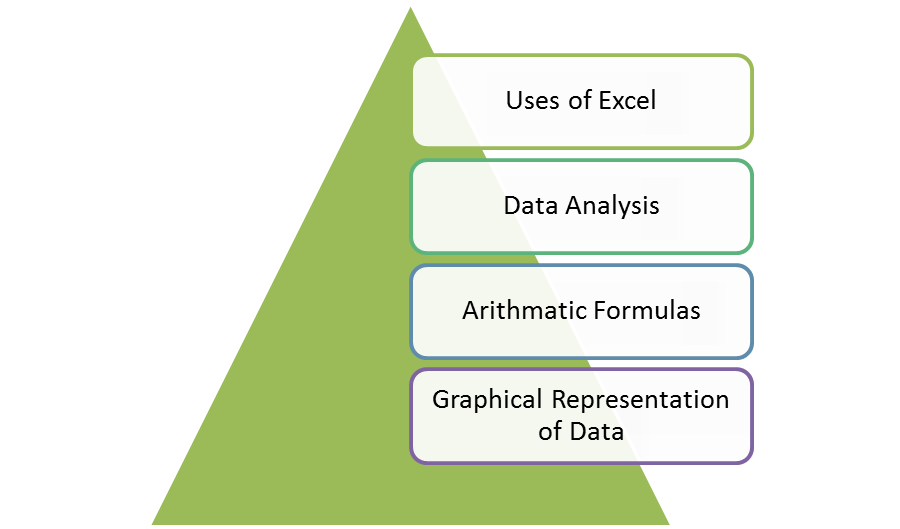
Uses of excel

More

  Course Content

Overview:

  • Navigate the user interface of MS Excel
  • Use of Excel Commands
  • Build and Save a Workbook
  • Enter a Cell Data

Creating a Microsoft Excel Workbook

  • Start Microsoft Excel
  • Create a Workbook
  • Save a Workbook
  • Status Bar
  • Add and Delete Worksheets
  • Copy and Move Worksheets
  • Change the order of Worksheets
  • Split the Worksheet window
  • Close a Workbook

Advanced Formulas

  • Using Named Ranges in Formulas
  • Naming a Single Cell
  • Naming of a Range of Cells
  • Naming to a Multiple Single Cells Rapidly
  • Use of Formulas That Span Multiple Worksheets
  • IF Function
  • AND/OR Functions
  • SUMIF, AVERAGEIF
  • COUNTIF Functions
  • PMT Function
  • LOOKUP Function
  • Using the VLOOKUP Function
  • HLOOKUP Function
  • UPPER Function
  • LOWER function
  • TRIM Function
  • Using the CONCATENATE Function
  • TRANSPOSE Function
  • PROPER, UPPER, and LOWER Functions
  • LEFT, RIGHT, and MID Functions
  • MID Function
  • Date Functions
  • NOW and TODAY Functions
  • Create Scenarios
  • Utilise the Watch Window
  • Consolidate Data
  • Enable Iterative Calculation
  • Financial Functions

Handling Lists

  • Convert a List into a Table
  • Remove Duplicates from a List
  • Sort Data in a List
  • Filter Data in a List
  • Add Subtotals to a List
  • Group and Ungroup Data in a List

 Handling with Illustrations

  • Working with Clip Art
  • Use Shapes
  • Work with SmartArt

Visualise Your Data

  • Create a Custom Chart Template
  • Insert Charts
  • Adding and Formatting of a Objects
  • Adding a Text Box
  • Creating a Custom Chart Template

Handling Lists

  • Sorting Data
  • Filtering Data
  • Querying Data with Database Functions

Handling Tables

  • Formatting Data in a Table
  • Move between Tables and Ranges
  • Modifying Tables
  • Defining Titles

Advanced Formatting

  • Apply Conditional Formatting
  • Working with Styles
  • Creating and Modifying Templates

Analysing Data

  • Create and Modify Tables
  • Apply Intermediate Conditional Formatting
  • Use Advanced Conditional Formatting


Build Charts in MS Excel 2016

  • Overview to Charts in Excel 2016
  • Inserting Charts in MS Excel and Learn the Various Chart Types
  • Formatting of Excel Charts
  • Creating a Bridge Chart in Excel 2016 - As Easy As It Gets
  • An Easy Way to Create a Treemap
  • Use Sparklines to Show Data Trends

Features New in 2016

  • Overview of Treemap
  • New Charts
  • Sunburst
  • Understand Histogram
  • Study Waterfall
  • Box and Whisker
  • Learn Pareto
More

Shortcuts of Excel

Shortcuts for the MS Excel:

To do this

Press

Close a spreadsheet

Ctrl+W

Open a spreadsheet

Ctrl+O

Go to the Home tab

Alt+H

Save a spreadsheet

Ctrl+S

Copy

Ctrl+C

Paste

Ctrl+V

Undo

Ctrl+Z

Remove cell contents

Delete key

Choose a fill color

Alt+H, H

Cut

Ctrl+X

Go to Insert tab

Alt+N

Bold

Ctrl+B

Center align cell contents

Alt+H, A, then C

Go to Page Layout tab

Alt+P

Go to Data tab

Alt+A

Go to View tab

Alt+W

Format a cell from context menu

Shift+F10, or

Context key

Add borders

Alt+H, B

Delete column

Alt+H, D, then C

Go to Formula tab

Alt+M


Vlookup(): It helps to search a value in a table and returns a corresponding value.


Syntax: = LOOKUP( value, lookup_range, [result_range] )


HLOOKUP(): The MS Excel HLOOKUP function performs a search for a value in the top row of the table and returns the value in the same column by index_number.


HLOOKUP( value, table, index_number, [approximate_match] )


Microsoft Excel 2016 Intermediate Enquiry


Enquire Now


----- OR -------

Reach us at +44 1344 961530 or info@pentagonit.co.uk for more information.

About Newcastle

Newcastle

Newcastle upon Tyne is also known as Newcastle is a city located in North East of England. Newcastle is 166 km south of Edinburgh, 466 km north of London on River Tyne northern bank. It is a populous city in Northeast and also forms the core of Tyneside conurbation. This core of Tyneside is the eighth most populous urban area in the United Kingdom. Earlier, Newcastle was part of Northumberland County until 1400 when it became country itself. Newcastle is a home to Newcastle University. University is a member of Russel group and Northumbria University.

The city was developed during ancient settlement. Newcastle got its name after a castle built in 1080 by Robert Curthose. It grew as an important wool trade centre in the 14th century and later as major coal mining area. In Newcastle port was developed in the 16th century. Shipyards down the River Tyne was among the world largest shipbuilding as well as ship repairing centres. Newcastle economy includes digital technology, tourism, retail, cultural centres, corporate headquarters and learning. With the help of these city contributes 13 Billion Euro toward GVA of United Kingdom. Icons of Newcastle are Tyne Bridge and Newcastle United Football.

History

Electric trams started in Newcastle upon Tyne streets in 1901. Later these trams were replaced by buses. In 1901 Laing Art Gallery was established. Shipley Art Gallery was opened in 1917. The first cinema in Newcastle was opened in 1909. In 1900 Redneugh Road Bridge was built. In 1906 King Edward VII Railways Bridge was established. In 1925 Hatton Gallery was founded and In 1928 Tyne Bridge, a Suspension bridge was erected. In 20th-century coal exports decreased. In 1956 last coal mine that was located within boundaries of Newcastle was closed. Shipbuilding also decreased. During 1930’s mass unemployment occurred in Newcastle. In 2000 Life Science Centre was opened and In 2001 Millennium Bridge was opened. The present population of Newcastle Upon Tyne is 284,000.

Economy

During the 19th century, Newcastle played a significant role in the industrial revolution. Newcastle was leading centre for shipbuilding, coal mining, engineering, manufacturing and munitions. In the second half of 20th century, heavy industries declined. The city is known for its commitment to environment related issues. A programme was planned for Newcastle to become ‘the first Carbon Neutral town’. These plans slowly slipped, and now it hopes to become carbon neutral by 2050. Newcastle is a commercial and educational focus for North East England. The economy of Newcastle contributes around 13 billion Euros to UK GVA. Central Business District is situated in the Centre of the city. This is bounded by the central station, Haymarket and Quayside areas.

More