A Quick Glance

  • black-arrow

    Simplify and communicate complex information with the globally used diagramming solution - MS Visio

  • black-arrow

    Create professional looking Class diagrams

  • black-arrow

    Know about eight key User Interface components of Visio 2016

  • black-arrow

    Add and manage Visio's Connectors, Smart Shapes, and Visual Objects

Microsoft Visio is a software designed to translate complete information from text and tables into diagrams. Visio diagrams simplify communication by breaking down information into different parts and making them understandable. It is used to create diagrams, workflows, networks, data flows, cause and effect diagrams, and charts represent processes.

Microsoft Visio is an authentic instrument used to create a pile of various data forms ranging from business flow charts to computer network diagram. Knowing how to use Visio will help delegates to bridge complexity with dynamic data-driven illustrations.

Who should take this course

This Microsoft Visio course is beneficial for professionals such as:

  • Architects, Civil and Structural Engineers
  • Software Architects
  • Software Professionals
  • All kinds of professionals who have to communicate complex ideas in visual and diagrammatic methods
  • Business Analysts
More

Prerequisites

  • Working with Windows files and folders
  • An understanding of drawing applications and designing methods
  • Basic level experience with Visio, especially the capability to create basic workflows and other essential diagram types in Visio
More

What Will You Learn

  • Visio interface navigation along with making a simple Visio document
  • Participants will get to modify, format and arrange shapes to make improvements in a basic diagram
  • Creating process diagrams
  • Participants will be creating route map with the use of Visio for working with shapes and text
  • Create Simple Custom Shapes
  • Make a Pivot Diagram from an Excel Spreadsheet
  • Essential steps to think when creating charts and graphs
  • How to enhanced format your charts and graphs like professionals work
  • How to use Pivot Tables and Pivot Charts
  • How to put together graphics into your spreadsheets
  • Learn the tools and options for exporting your charts and graphs
  • Learn the limitations of pie charts and the top way to correct them
  • Find out how to deal with difficult trends in charts and graphs
  • Find out how to make use of a bar chart and a pie chart to highlight the differences in a data set
  • Learning Layers Properties dialogue box
  • Working with shape estimates
  • Combine a Map to an Access Database
  • Save and Share Designs with OneDrive
  • One-Step data connectivity with Excel
  • Formulate Custom Stencils
  • Create Custom Templates
  • Delegates will learn to create advanced plans and diagrams
  • Delegates will get to enhance the look of drawings
  • Participants will get to create shapes, stencils, and templates
  • You will learn to connect pictures to external data
  • Candidates will learn to leverage development tools
  • Share drawings
  • Participants will get to use diagram standards (optional)
  • Improve look of drawings
  • Generate forms, stencils, and patterns
  • Connect pictures to external data
  • Work with type design
  • Development tools
  • Share drawings
  • Working with other forms
  • One-Step data connectivity with Excel
  • Collaboration
  • File arrangements
  • Debate Information Rights Management (IRM)
More

What's included

  Course Overview

Microsoft Visio visual images are used to represent knowledge, data, and information. It is applied to the workplace; visual drawings are an essential part of the flow charts. MS Visio 2016 delivers you with an intuitive, customizable tool to quickly create a professional looking graphic product by using its extensive gallery of shapes. In this course, delegates will create visually appealing diagrams, maps, and drawings, using graphical rudiments to make information easier to comprehend.

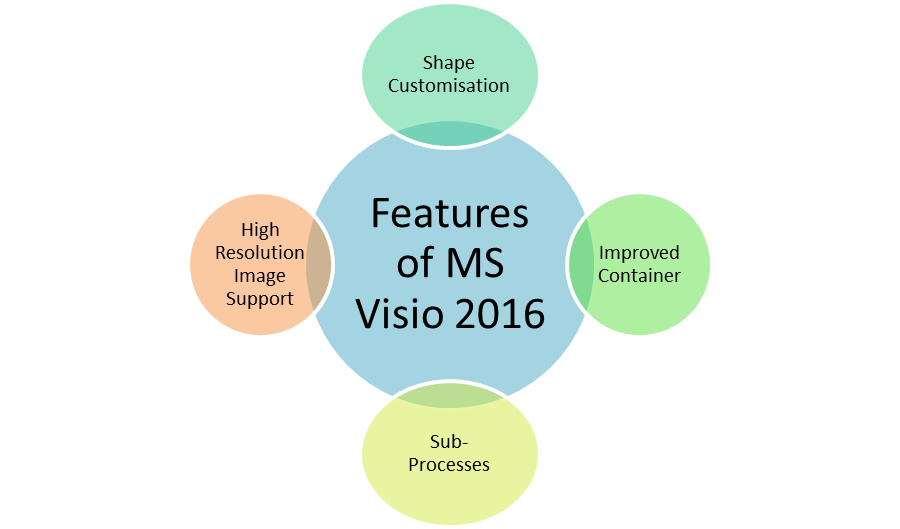
features of MS Visio 2016

Exam Duration:

  • Duration: 3 Hours
  • Type: Open book
  • This exam consists of 4 Section (1 for each perspective)
  • Each section contain 20 individual questions giving total 80 questions in this exam
  • Passing Marks = 50%
More

  Course Content

Getting Started with Visio 

  • Navigate the Visio Setting
  • Understanding ribbons and Quick Access Toolbar
  • Opening, Saving and file extensions

Workflow with Shapes

  • Use Drawing Components
  • Finding Drawing shapes
  • Moving and manipulating shapes
  • Copying shapes
  • Filling and Outlining shapes
  • Changing stack order

Text

  • Adding text to shapes
  • Formatting Text
  • Modifying Text location
  • Free Text objects, Titles, etc

Creating Flowcharts

  • Using the Flowchart stencils
  • Create a Basic Flow Chart
  • Modify and manipulating diagrams

Scale Drawing

  • Using the Scale Drawing Plan Templates
  • Setting the scale
  • Using Basic Floor Plan shapes
  • Model a Room Layout

Layers

  • Use Shape Data
  • Use Layers 

Making a Network Diagram

  • Network Graphs
  • Use Shape Data
  • Use Layers

Styling a Diagram

  • Form and Connector Styles
  • Themes and Variants
  • Use Containers

Creating an Organisation Chart

  • Using the Visio Templates
  • Creating shapes
  • Adding and storing data

Creating Bespoke Shapes with Operations

  • Using Boolean drawing objects
  • Union
  • Combine
  • Fragment
  • Intersect
  • Subtract

Creating A Shape Stencil

  • Using your My Shapes Stencil
  • Adding to Favourites
  • Creating a New Stencil
  • Adding Shapes

Saving as HTML

  • Creating a web diagram
  • Saving as web page and Publish options
  • Understanding Shape data
  • Combining form data

Design Plans and Diagrams:

  • Formulate a Microsoft Account and Log Into Visio
  • Make Advanced Plans
  • Create Advanced Diagrams

Change the Design of Drawings:

  • Use 3-D Structures
  • Effort with Shape Styles
  • Describe Shape Styles
  • Apply Backgrounds, Borders, and Titles

Forming with Custom Shapes, Stencils, and Patterns:

  • Generate Simple Custom Shapes
  • Formulate Custom Stencils
  • Create Custom Templates

Combining Drawings to External Data:

  • Make an Association Chart from an Excel Spreadsheet
  • Create a Pivot Diagram from an Excel Spreadsheet
  • Formulate a Gantt Chart from a Project File
  • Create a Timeline from a Project Record
  • Combine a Map to an Access Database

Leveraging Development Tools:

  • Create Macros
  • Modify ShapeSheets
  • Build Advanced Shapes

Distribution Drawings:

  • Save and Share Designs with OneDrive
  • Review Drawings
  • Addition Drawings into Other Office Records
  • Distribute Drawings
  • Print Drawings

Essential skills:

  • Visio screen
  • Visio tools
  • Quick Import

 Forms of Working:

  • Group forms
  • Aligning and distributing forms
  • Resizing shapes
  • Moving shapes
  • Working ‘Pan and Zoom

Customising Main Shapes:

  • Working with form estimates
  • Working with custom features
  • Formulating master field lists

Layers:

  • Learning Layers Properties dialogue box
  • Exploring existing Visio layers
  • Expressing new layers
  • Energetic Layers
  • Protected Layers
  • Wallop Layers
  • Layers on Backgrounds

 Stencils Working:

  • Using existing stencils
  • Performing ‘Document’ stencils
  • Creating customised stencils
  • Creating new original shapes

File Security:

  • Data Rights Management
  • Protecting data against changes
  • Protecting Templates
  • Converting files to Adobe (.pdf) format
More


Microsoft Visio 2016 Introduction Enquiry


Enquire Now


----- OR -------

Reach us at +44 1344 961530 or info@pentagonit.co.uk for more information.

About Cambridge

Cambridge is a university city and the county town in Cambridgeshire in England. It is located on the River Cam about 50 miles north of London. Its population is about 123,867. It is situated at the heart of the high-technology Silicon Fen with industries like software and bioscience and many more start-up organisations.  

Governance

Local Government

Cambridge is a non-metropolitan district that is served by Cambridge City Council in England. Cambridge Local Authority District covers most of the urban area of the city. The headquarters of the city is in Guildhall (large building in the market square). In 1207, King John granted the Cambridge, which allowed the appointment of a mayor. Now, mayors are elected annually.

Westminster

Most of the city is protected by the parliament constituency of Cambridge. In general elections of 2015, Daniel Zeichner was elected as Member of Parliament (MP). He was re-elected in the general elections of 2017. Heidi Allen is the MP of Queen Edith’s ward that lies in the South Cambridgeshire constituency. Heidi Allen was also elected in 2015 and was re-elected in 2017.

Geography

Cambridge is located about 50 miles north-by-east of the London. This county town was historically surrounded by low-lying wetlands which have been drained with the expansion of the town. The river calm flows through the village of Grantchester to the south-west.

Climate

Cambridge has two official weather observing stations. One is National Institute of Agricultural Botany, and another is Cambridge University Botanic Garden. Also, the University's Computer Laboratory displays weather conditions online through web browsers.

Ecology

Cambridge contains three sites of scientific Interest at Cherry Hinton West Pit, Cherry Hinton East Pit and Travellers Pit, and ten Local Nature Reserves.

Demography

It’s hard to measure demography of Cambridge as it changes considerably. In 2001 census, 89.44% residents of Cambridge identified themselves as white. Inside University, 84% of undergraduates and 80% postgraduates identify themselves as white. Cambridge has a higher proportion than average of people paid in managerial and administrative jobs and much lower than average proportion of manual workers. Also, much higher than average proportion of people having a high-level qualification like degree, Master’s, PhD or Higher National Diploma.

More