A Quick Glance

  • black-arrow

    Simplify and communicate complex information with the globally used diagramming solution - MS Visio

  • black-arrow

    Create professional looking Class diagrams

  • black-arrow

    Know about eight key User Interface components of Visio 2016

  • black-arrow

    Add and manage Visio's Connectors, Smart Shapes, and Visual Objects

Microsoft Visio is a software designed to translate complete information from text and tables into diagrams. Visio diagrams simplify communication by breaking down information into different parts and making them understandable. It is used to create diagrams, workflows, networks, data flows, cause and effect diagrams, and charts represent processes.

Microsoft Visio is an authentic instrument used to create a pile of various data forms ranging from business flow charts to computer network diagram. Knowing how to use Visio will help delegates to bridge complexity with dynamic data-driven illustrations.

Who should take this course

This Microsoft Visio course is beneficial for professionals such as:

  • Architects, Civil and Structural Engineers
  • Software Architects
  • Software Professionals
  • All kinds of professionals who have to communicate complex ideas in visual and diagrammatic methods
  • Business Analysts
More

Prerequisites

  • Working with Windows files and folders
  • An understanding of drawing applications and designing methods
  • Basic level experience with Visio, especially the capability to create basic workflows and other essential diagram types in Visio
More

What Will You Learn

  • Visio interface navigation along with making a simple Visio document
  • Participants will get to modify, format and arrange shapes to make improvements in a basic diagram
  • Creating process diagrams
  • Participants will be creating route map with the use of Visio for working with shapes and text
  • Create Simple Custom Shapes
  • Make a Pivot Diagram from an Excel Spreadsheet
  • Essential steps to think when creating charts and graphs
  • How to enhanced format your charts and graphs like professionals work
  • How to use Pivot Tables and Pivot Charts
  • How to put together graphics into your spreadsheets
  • Learn the tools and options for exporting your charts and graphs
  • Learn the limitations of pie charts and the top way to correct them
  • Find out how to deal with difficult trends in charts and graphs
  • Find out how to make use of a bar chart and a pie chart to highlight the differences in a data set
  • Learning Layers Properties dialogue box
  • Working with shape estimates
  • Combine a Map to an Access Database
  • Save and Share Designs with OneDrive
  • One-Step data connectivity with Excel
  • Formulate Custom Stencils
  • Create Custom Templates
  • Delegates will learn to create advanced plans and diagrams
  • Delegates will get to enhance the look of drawings
  • Participants will get to create shapes, stencils, and templates
  • You will learn to connect pictures to external data
  • Candidates will learn to leverage development tools
  • Share drawings
  • Participants will get to use diagram standards (optional)
  • Improve look of drawings
  • Generate forms, stencils, and patterns
  • Connect pictures to external data
  • Work with type design
  • Development tools
  • Share drawings
  • Working with other forms
  • One-Step data connectivity with Excel
  • Collaboration
  • File arrangements
  • Debate Information Rights Management (IRM)
More

What's included

  Course Overview

Microsoft Visio visual images are used to represent knowledge, data, and information. It is applied to the workplace; visual drawings are an essential part of the flow charts. MS Visio 2016 delivers you with an intuitive, customizable tool to quickly create a professional looking graphic product by using its extensive gallery of shapes. In this course, delegates will create visually appealing diagrams, maps, and drawings, using graphical rudiments to make information easier to comprehend.

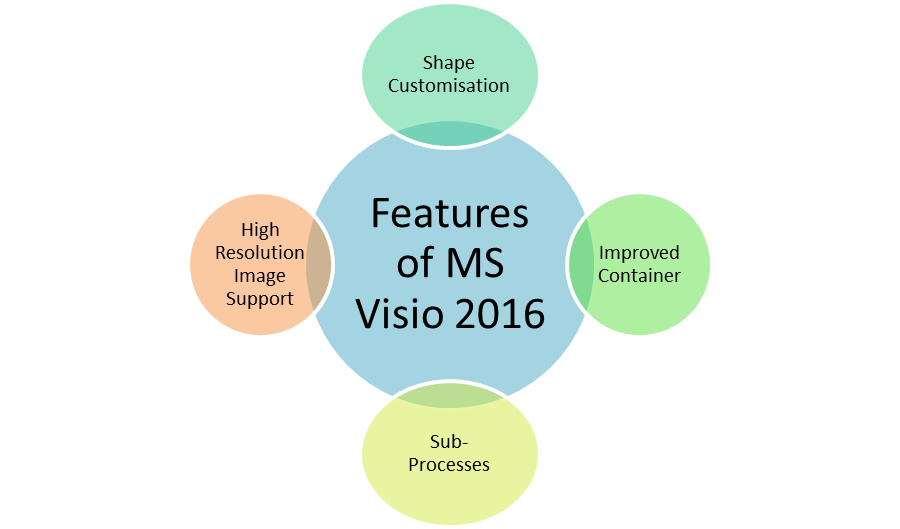
features of MS Visio 2016

Exam Duration:

  • Duration: 3 Hours
  • Type: Open book
  • This exam consists of 4 Section (1 for each perspective)
  • Each section contain 20 individual questions giving total 80 questions in this exam
  • Passing Marks = 50%
More

  Course Content

Getting Started with Visio 

  • Navigate the Visio Setting
  • Understanding ribbons and Quick Access Toolbar
  • Opening, Saving and file extensions

Workflow with Shapes

  • Use Drawing Components
  • Finding Drawing shapes
  • Moving and manipulating shapes
  • Copying shapes
  • Filling and Outlining shapes
  • Changing stack order

Text

  • Adding text to shapes
  • Formatting Text
  • Modifying Text location
  • Free Text objects, Titles, etc

Creating Flowcharts

  • Using the Flowchart stencils
  • Create a Basic Flow Chart
  • Modify and manipulating diagrams

Scale Drawing

  • Using the Scale Drawing Plan Templates
  • Setting the scale
  • Using Basic Floor Plan shapes
  • Model a Room Layout

Layers

  • Use Shape Data
  • Use Layers 

Making a Network Diagram

  • Network Graphs
  • Use Shape Data
  • Use Layers

Styling a Diagram

  • Form and Connector Styles
  • Themes and Variants
  • Use Containers

Creating an Organisation Chart

  • Using the Visio Templates
  • Creating shapes
  • Adding and storing data

Creating Bespoke Shapes with Operations

  • Using Boolean drawing objects
  • Union
  • Combine
  • Fragment
  • Intersect
  • Subtract

Creating A Shape Stencil

  • Using your My Shapes Stencil
  • Adding to Favourites
  • Creating a New Stencil
  • Adding Shapes

Saving as HTML

  • Creating a web diagram
  • Saving as web page and Publish options
  • Understanding Shape data
  • Combining form data

Design Plans and Diagrams:

  • Formulate a Microsoft Account and Log Into Visio
  • Make Advanced Plans
  • Create Advanced Diagrams

Change the Design of Drawings:

  • Use 3-D Structures
  • Effort with Shape Styles
  • Describe Shape Styles
  • Apply Backgrounds, Borders, and Titles

Forming with Custom Shapes, Stencils, and Patterns:

  • Generate Simple Custom Shapes
  • Formulate Custom Stencils
  • Create Custom Templates

Combining Drawings to External Data:

  • Make an Association Chart from an Excel Spreadsheet
  • Create a Pivot Diagram from an Excel Spreadsheet
  • Formulate a Gantt Chart from a Project File
  • Create a Timeline from a Project Record
  • Combine a Map to an Access Database

Leveraging Development Tools:

  • Create Macros
  • Modify ShapeSheets
  • Build Advanced Shapes

Distribution Drawings:

  • Save and Share Designs with OneDrive
  • Review Drawings
  • Addition Drawings into Other Office Records
  • Distribute Drawings
  • Print Drawings

Essential skills:

  • Visio screen
  • Visio tools
  • Quick Import

 Forms of Working:

  • Group forms
  • Aligning and distributing forms
  • Resizing shapes
  • Moving shapes
  • Working ‘Pan and Zoom

Customising Main Shapes:

  • Working with form estimates
  • Working with custom features
  • Formulating master field lists

Layers:

  • Learning Layers Properties dialogue box
  • Exploring existing Visio layers
  • Expressing new layers
  • Energetic Layers
  • Protected Layers
  • Wallop Layers
  • Layers on Backgrounds

 Stencils Working:

  • Using existing stencils
  • Performing ‘Document’ stencils
  • Creating customised stencils
  • Creating new original shapes

File Security:

  • Data Rights Management
  • Protecting data against changes
  • Protecting Templates
  • Converting files to Adobe (.pdf) format
More


Microsoft Visio 2016 Introduction Enquiry


Enquire Now


----- OR -------

Reach us at +44 1344 961530 or info@pentagonit.co.uk for more information.

About Sheffield

Sheffield is a city area in South Yorkshire, England. Actually part of the West Riding of Yorkshire, its name originates from the River Sheaf, which innings through the city. With some of its southern suburbs occupied from Derbyshire, the city has grown up from its main manufacturing roots to include a broader economic base.

In the 19th century, Sheffield increased a global reputation for steel manufacture. Known as the Steel City, many novelties were industrialised nearby, counting container and stainless steel, powering an almost tenfold increase in the population in the Industrial Rebellion. Sheffield conventional its public charter in 1843, flattering the City of Sheffield in 1893. International rivalry in iron and steel produced a weakening in these businesses in the 1970s and 1980s, according to with the failure of coal withdrawal in the area.

Government:

Sheffield is ruled at the local level by Sheffield City Council. It contains 84 councillors chosen to signify 28 words: three councillors per district. Following the 2016 local votes, the delivery of assembly places is Labor. The city also has a Lord Mayor though now just a ritual position, in the past, the office approved substantial authority, with decision-making powers over the funds and businesses of the city assembly.

Much of its past the assembly was skilful by the Labor Party, and was noted for its leftist understandings; during the 1980s, when David Blunkett ran Sheffield City Council, the area augmented the epithet the Socialist Republic of South Yorkshire. Though, the Liberal Democrats measured the Council between 1999 and 2001 and took control again from 2008 to 2011.

Climate:

Like the break of the United Kingdom, the weather in Sheffield is usually temperate. The Pennies to the west of the city can make a cool, depressed and wet atmosphere, but they also deliver shelter from the usual westerly breezes, forming rain shadow across the area.  Between 1971 and 2000 Sheffield be about 824.7 millimetres (32.47 in) of rain per year. December was the rainiest month with 91.9 millimetres (3.62 in) and July the dehydrated with 51.0 millimetres (2.01 in). July was also the hottest month, with an average maximum temperature of 20.8 °C (69.4 °F). The regular least temperature in January and February was 1.6 °C (34.9 °F), however the lowermost heats recorded in these months can be between −10 and −15 °C (14 and 5 °F), though since 1960, the temperature has never fallen below −9.2 °C (15.4 °F), signifying that urbanization around the Weston Park site during the second half of the 20th century may stop temperatures below −10 °C (14 °F) happening.

More